こんにちは、usagi-sanです。
今回は、統計解析やデータ解析用のスクリプト言語であるR言語を用いてマインスイーパーを作成しました。
R言語は手続き型の言語であるため、クラスを定義することはほとんどありませんが、今回ゲームを作成するということでクラスを定義し、オブジェクト指向でスクリプトを書いてみました。
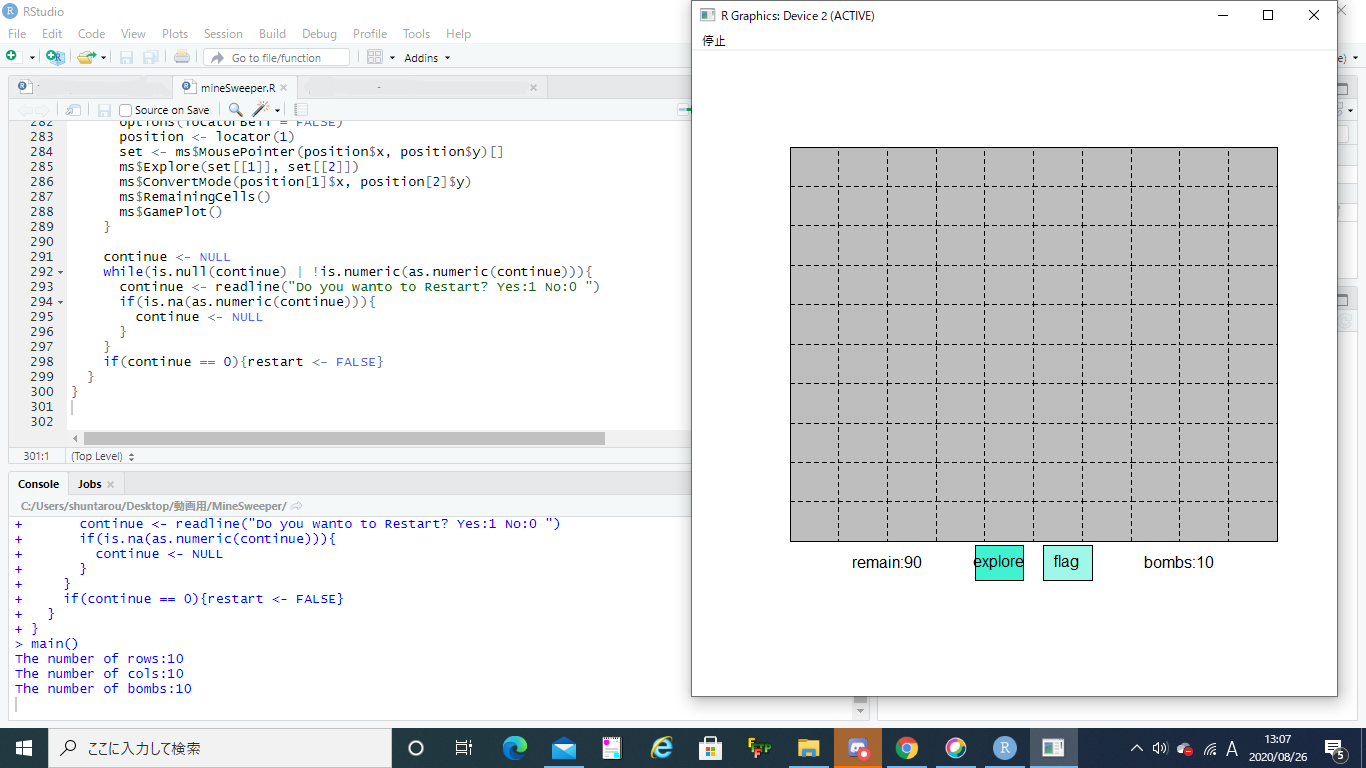
マインスイーパーは、次の画像のようにR言語のwindow上で遊ぶことができます。

マインスイーパ実行画面
マインスイーパーのプログラミングコードはこの記事の一番下でダウンロードできます。
クラスの定義の仕方の勉強したい方や興味のある方は、是非是非ダウンロードしてください。
クラス mineSweeper
マインスイーパーのアルゴリズムや描画するメソッドなどから成るクラスmineSweeperを紹介します。
クラスmineSweeperは次のフィールドとメソッドから構成されています。
フィールド
- n_row = "numeric"
- n_col = "numeric"
- n_bomb = "numeric"
- df = "data.frame"
- exploredTile = "data.frame"
- flaggedTile = "data.frame"
- gameEnd = "logical"
- mode = "character"
- remainingCells = "numeric"
メソッド
- Initialize = function()
- Start = function()
- Explore = function(x,y)
- GameStartPlot = function()
- GamePlot = function()
- MousePointer = function(x,y)
- ConvertMode = function(x, y)
- RemainingCells = function()
このクラスのインスタンスを生成し、メソッドをmain()で実行することで、マインスイーパーを実行することができます。
これらのフィールドとメソッドの意味や役割は次で紹介していきます。
フィールド
n_row
マインスイーパーの行の数を指定する。ゲーム開始時に指定した行数がn_rowに代入されます。
n_col
マインスイーパーの列の数を指定する。ゲーム開始時に指定した列数がn_colに代入されます。
n_bomb
マインスイーパーの地雷の数を指定する。ゲーム開始時に指定した地雷の数がn_bombに代入されます。
df
マインスイーパーの盤面の地雷の位置や、接している地雷の数などの情報を格納するためのデータフレーム。接している地雷の数が1,2,3,4,...の場合dfには、対応する地雷の数が代入されます。また地雷は-1として表現されます。
exploredTile
探索済みの盤面を代入します。TRUEはすでに探索済みのセルであり、FALSEの場合は探索していないセルを表現します。TRUEの盤面のみがGUI上で描画されます。
flaggedTile
旗付きのセルを格納するデータフレーム。TRUEの場合、旗が付いていて、FALSEの場合、旗がついていないことを表現します。後述するmodeがflagのときにクリックしたセルに対応するflaggedTileがTRUEとなります。
gameEnd
ゲームが続いているか、終了しているかを表すlogical型の変数。
mode
探索するか、旗を付けるかを表すcharacter型の変数。modeがexploreの場合、選択したセルを探索します(セルを開ける)。flagの場合、選択したセルに旗を付けます。
remainingCells
未探索のセルの数を表すnumeric型の変数。
メソッド
Initialize
Initializeは、フィールドの変数を初期化するためのメソッドです。
インスタンスの生成後に、このメソッドを実行することで、フィールドの変数を初期化できます。
gameEnd、mode、remainigCells、df、eploredTile、flaggedTileなどの変数を初期化しています。
1 2 3 4 5 6 7 8 9 10 11 12 13 14 15 16 17 18 19 | Initialize = function(){ gameEnd <<- FALSE mode <<- "explore" remainingCells <<- n_row * n_col - n_bomb df <<- data.frame(matrix(rep(NA, n_row), nrow = n_row))[,numeric(0)] for(i in 1:n_col){ df <<- cbind(df, rep(0,n_row)) } exploredTile <<- data.frame(matrix(rep(F, n_row), nrow = n_row))[,numeric(0)] for(i in 1:n_col){ exploredTile <<- cbind(exploredTile, rep(F,n_row)) } flaggedTile <<- data.frame(matrix(rep(F, n_row), nrow = n_row))[,numeric(0)] for(i in 1:n_col){ flaggedTile <<- cbind( flaggedTile, rep(F,n_row)) } } |
Start
Initializeで初期化したdfに盤面の情報を与えるメソッドです。
dfに地雷の数n_bombの数だけ、-1を代入し地雷の情報を与えます。
そのあとはdfの-1の位置を頼りに、-1に接している数をdfの各要素に代入していきます。
1 2 3 4 5 6 7 8 9 10 11 12 13 14 15 16 17 18 19 20 21 22 23 24 25 26 27 28 29 30 31 32 33 34 35 36 37 38 39 40 41 | Start = function(){ xy_bomb <- NULL for(i in 1:n_bomb){ xy <- sample(setdiff(1:(n_row*n_col), xy_bomb),1) xy_bomb[i] <- xy df[(xy%/%n_col)+1,(xy%%n_row)+1] <<- (-1) } for(i in 1:n_row){ for(j in 1:n_col){ if(df[i,j]!=-1){ count <- 0 if(i < n_row){ if(df[i+1,j] == -1){count <- count + 1} } if(i > 1){ if(df[i-1,j] == -1){count <- count + 1} } if(j < n_col){ if(df[i,j+1] == -1){count <- count + 1} } if(j > 1){ if(df[i,j-1] == -1){count <- count + 1} } if(i < n_row & j < n_col){ if(df[i+1,j+1] == -1){count <- count + 1} } if(i < n_row & j > 1){ if(df[i+1,j-1] == -1){count <- count + 1} } if(i > 1 & j < n_col){ if(df[i-1,j+1] == -1){count <- count + 1} } if(i > 1 & j > 1){ if(df[i-1,j-1] == -1){count <- count + 1} } df[i,j] <<- count } } } } |
Explore
マウスでクリックした座標をもとに、dfを探索していくメソッドです。
マインスイーパーの探索法と同様に、指定された座標x,yから再帰的に探索していきます。
1,2, . . . , 8まで探索し、探索後の座標はexploredTileの対応する座標にTRUEを代入し、return()を返し、探索を終了します。
1 2 3 4 5 6 7 8 9 10 11 12 13 14 15 16 17 18 19 20 21 22 23 24 25 26 27 28 29 30 31 32 33 34 35 36 37 38 39 40 41 42 43 44 45 46 47 48 49 50 51 52 | Explore = function(x,y){ if(x <= n_row & x >= 1 & y <= n_col & y >= 1){ if(mode == "explore"){ if(df[x,y] == -1 & exploredTile[x,y] == F){ exploredTile[x,y] <<- T gameEnd <<- TRUE return() }else if(df[x,y] >= 1 & exploredTile[x,y] == F){ exploredTile[x,y] <<- T return() }else if(df[x,y] == 0 & exploredTile[x,y] == F){ if(x < n_row){ exploredTile[x,y] <<- T Explore(x+1,y) } if(x > 1){ exploredTile[x,y] <<- T Explore(x-1,y) } if(y < n_col){ exploredTile[x,y] <<- T Explore(x,y+1) } if(y > 1){ exploredTile[x,y] <<- T Explore(x,y-1) } if(x < n_row & y < n_col){ exploredTile[x,y] <<- T Explore(x+1,y+1) } if(x < n_row & y > 1){ exploredTile[x,y] <<- T Explore(x+1,y-1) } if(x > 1 & y < n_col){ exploredTile[x,y] <<- T Explore(x-1,y+1) } if(x > 1 & y > 1){ exploredTile[x,y] <<- T Explore(x-1,y-1) } } }else{ if(flaggedTile[x,y] == F){ flaggedTile[x,y] <<- T return() } } } } |
GameStartPlot
マインスイーパーを開始したときのゲーム画面をplotで描画します。
マインスイーパーの盤面の格子や枠、exploreボタンやflagボタンの描画などをゲーム開始時に行います。
ゲームを開始した後はGameStartPlotではなく、次で紹介するGamePlotでゲームを描画していきます。
1 2 3 4 5 6 7 8 9 10 11 12 13 14 15 16 17 18 19 | GameStartPlot = function(){ windows(n_col,n_row) plot.new() for(i in 1:n_row){ for(j in 1: n_col){ rect((j-1)/n_col , (1 - i/(n_row + 1)) , j/n_col, ( 1 + (1-i)/(n_row + 1)) , col = "grey", pin = c(n_col, (n_row + 1)), lty = 2) } } rect(0 , (1 - n_row/(n_row + 1)) , 1, 1 , pin = c(n_col, (n_row + 1))) rect(0.38, 0, 0.48, 1/(n_row + 1) - 1/(10*(n_row + 1)), col = rgb(0.25, 0.95, 0.81)) text(list(x=0.43 ,y=1/(2*(n_row + 1))), labels = "explore") rect(0.52, 0, 0.62, 1/(n_row + 1) - 1/(10*(n_row + 1)), col = rgb(0.25, 0.95, 0.81, alpha = 0.5)) text(list(x=0.57 ,y=1/(2*(n_row + 1))), labels = "flag") text(list(x=0.2 ,y=1/(2*(n_row + 1))), labels = paste0("remain:", remainingCells)) text(list(x=0.8 ,y=1/(2*(n_row + 1))), labels = paste0("bombs:", n_bomb)) } |
GamePlot
GamePlotは、マインスイーパーを実行中に、セルの選択やexploreやflagボタンを押した後に実行されるメソッドです。
盤面の情報が更新された後に、このメソッドを用いてGUI上の描画も更新していきます。
また画像ファイルを読み込み、ゲーム終了時のGame ClearやGame overなどの描画を行ったり、地雷の画像や旗の画像などを描画したりしています。
1 2 3 4 5 6 7 8 9 10 11 12 13 14 15 16 17 18 19 20 21 22 23 24 25 26 27 28 29 30 31 32 33 34 35 36 37 38 39 40 41 42 43 44 45 46 47 48 49 50 51 52 53 54 55 56 57 58 59 60 61 | GamePlot = function(){ library(png) pass <- getwd() setwd(paste0(pass, "/", "Picture")) bombImage <- readPNG("bomb.png") flagImage <- readPNG("flag.png") gameOverImage <- readPNG("gameover.png") gameClearImage <- readPNG("gameclear.png") setwd(pass) for(i in 1:n_row){ for(j in 1:n_col){ if(df[i,j] == 0 & exploredTile[i,j] == T){ rect((j-1)/n_col , (1 - i/(n_row + 1)),j/n_col, ( 1 + (1-i)/(n_row + 1)), col = "white", pin = c(n_col, (n_row+1))) } else if(df[i,j] >= 1 & exploredTile[i,j] == T){ rect((j-1)/n_col , (1 - i/(n_row + 1)),j/n_col, ( 1 + (1-i)/(n_row + 1)), col = "white", pin = c(n_col, (n_row + 1))) text(list(x=(2*j-1)/(2*n_col) ,y=(1 + (1-2*i)/(2*(n_row + 1)))), labels = as.character(df[i,j])) } else if(df[i,j] == -1 & exploredTile[i,j] == T){ if(mode == "explore"){ for(m in 1:n_row){ for(n in 1:n_col){ if(df[m,n] == -1){ rect((n-1)/n_col , (1 - m/(n_row + 1)), n/n_col, ( 1 + (1-m)/(n_row + 1)), col = "white", pin = c(n_col, (n_row + 1))) rasterImage(bombImage, (n-1)/n_col , (1 - m/(n_row + 1)),n/n_col, ( 1 + (1-m)/(n_row + 1))) } } } } }else if(flaggedTile[i,j] == T){ rect((j-1)/n_col , (1 - i/(n_row + 1)), j/n_col, ( 1 + (1-i)/(n_row + 1)), col = "white", pin = c(n_col, (n_row + 1))) rasterImage(flagImage, (j-1)/n_col , (1 - i/(n_row + 1)),j/n_col, ( 1 + (1-i)/(n_row + 1))) } } } rect(0.1, 0, 0.3, 1/(n_row + 1) - 1/(10*(n_row + 1)), col = "white", lty = 0) text(list(x=0.2 ,y=1/(2*(n_row + 1))), labels = paste0("remain:", remainingCells)) rect(0.7, 0, 0.9, 1/(n_row + 1) - 1/(10*(n_row + 1)), col = "white", lty = 0) text(list(x=0.8 ,y=1/(2*(n_row + 1))), labels = paste0("bombs:", n_bomb)) if(mode == "explore"){ rect(0.38, 0, 0.48, 1/(n_row + 1) - 1/(10*(n_row + 1)), col = "white") rect(0.38, 0, 0.48, 1/(n_row + 1) - 1/(10*(n_row + 1)), col = rgb(0.25, 0.95, 0.81)) text(list(x=0.43 ,y=1/(2*(n_row + 1))), labels = "explore") rect(0.52, 0, 0.62, 1/(n_row + 1) - 1/(10*(n_row + 1)), col = "white") rect(0.52, 0, 0.62, 1/(n_row + 1) - 1/(10*(n_row + 1)), col = rgb(0.25, 0.95, 0.81, alpha = 0.5)) text(list(x=0.57 ,y=1/(2*(n_row + 1))), labels = "flag") }else if(mode == "flag"){ rect(0.38, 0, 0.48, 1/(n_row + 1) - 1/(10*(n_row + 1)), col = "white") rect(0.38, 0, 0.48, 1/(n_row + 1) - 1/(10*(n_row + 1)), col = rgb(0.25, 0.95, 0.81, alpha = 0.5)) text(list(x=0.43 ,y=1/(2*(n_row + 1))), labels = "explore") rect(0.52, 0, 0.62, 1/(n_row + 1) - 1/(10*(n_row + 1)), col = "white") rect(0.52, 0, 0.62, 1/(n_row + 1) - 1/(10*(n_row + 1)), col = rgb(0.25, 0.95, 0.81)) text(list(x=0.57 ,y=1/(2*(n_row + 1))), labels = "flag") } if(gameEnd == TRUE & remainingCells == 0){ rasterImage(gameClearImage, 0, 0, 1, 1) }else if(gameEnd == TRUE & remainingCells > 0){ rasterImage(gameOverImage, 0, 0, 1, 1) } } |
MousePointer
マウスの左クリックの座標を取得し、GUI上の[0, 1]の値をとる座標を対応する盤面の(x, y)座標に変換するメソッドです。
例えばGUI上では、x軸は0から1の値をとるように設定されています。フィールド中のdfやexploredTileの対応するx座標を得たい場合、x軸を、1から列の数に変換する必要があります。
1 2 3 4 5 6 7 8 9 10 11 12 13 14 15 | MousePointer = function(x,y){ x0 <- 0 y0 <- 0 for(i in 1:(n_row+1)){ if((1 - i/(n_row + 1)) <= y & y <= (1 + (1-i)/(n_row + 1))){ y0 <- i } } for(i in 1:n_col){ if((i-1)/n_col <= x & x <= i/n_col){ x0 <- i } } return(list(y0, x0)) } |
ConvertMode
メソッドConvertModeは、ゲームモードをexploreやflagに切り替えます。
GUI上で左クリックした座標が、exploreボタンやflagボタンであった場合、そのボタンに対応するゲームモードに切り替えます。
例えば、flagボタンがクリックされた場合、ゲームモードはflagに切り替わり、盤面に旗を設置できるようになります。
1 2 3 4 5 6 7 8 9 10 | ConvertMode = function(x, y){ if(y < ( 1 + (1-n_row)/(n_row + 1))){ if(x >= 0.38 & x <= 0.48 & y <= 1/(n_row + 1) - 1/(10*(n_row + 1))){ mode <<- "explore" } if(x >= 0.52 & x <= 0.62 & y <= 1/(n_row + 1) - 1/(10*(n_row + 1))){ mode <<- "flag" } } } |
RemainingCells
メソッドRemainingCellsは、盤面に残っている地雷以外のセルの数を求めます。
メソッドGamePlotで、左下の残りのセル数を描画する際に、このメソッドで求めたセルの数が用いられます。
1 2 3 4 5 6 7 | RemainingCells = function(){ tileVec <- as.vector(exploredTile) remainingCells <<- (n_row * n_col - n_bomb) - length(tileVec[tileVec == TRUE]) if(remainingCells== 0){ gameEnd <<- TRUE } } |
ゲームの開始方法
main()
ゲームを開始するには以下の関数main()を実行します。コンソール上でmain()と入力することで、ゲームを開始することができます。
1 2 3 4 5 6 7 8 9 10 11 12 13 14 15 16 17 18 19 20 21 22 23 24 25 26 27 28 29 30 31 32 33 34 35 36 37 38 39 40 41 42 43 44 45 46 47 48 49 50 | main <- function(){ restart <- TRUE while(restart == TRUE){ numberOfRows <- NULL numberOfCols <- NULL numberOfBombs <- NULL while(is.null(numberOfRows) | !is.numeric(as.numeric(numberOfRows))){ numberOfRows <- readline("The number of rows:") if(is.na(as.numeric(numberOfRows))){ numberOfRows <- NULL } } while(is.null(numberOfCols) | !is.numeric(as.numeric(numberOfCols))){ numberOfCols <- readline("The number of cols:") if(is.na(as.numeric(numberOfCols))){ numberOfCols <- NULL } } while(is.null(numberOfBombs) | !is.numeric(as.numeric(numberOfBombs))){ numberOfBombs <- readline("The number of bombs:") if(is.na(as.numeric(numberOfBombs))){ numberOfBombs <- NULL } } ms <- new("mineSweeper", n_row = as.numeric(numberOfRows), n_col = as.numeric(numberOfCols), n_bomb = as.numeric(numberOfBombs)) ms$Initialize() ms$Start() ms$GameStartPlot() while(ms$gameEnd == FALSE){ options(locatorBell = FALSE) position <- locator(1) set <- ms$MousePointer(position$x, position$y)[] ms$Explore(set[[1]], set[[2]]) ms$ConvertMode(position[1]$x, position[2]$y) ms$RemainingCells() ms$GamePlot() } continue <- NULL while(is.null(continue) | !is.numeric(as.numeric(continue))){ continue <- readline("Do you wanto to Restart? Yes:1 No:0 ") if(is.na(as.numeric(continue))){ continue <- NULL } } if(continue == 0){restart <- FALSE} } } |
main()を実行すると、マインスイーパーの行、列、地雷の数などをreadline()で入力した後に、mineSweeperクラスのインスタンスを生成し、各メソッドを動的に用いてゲームのシーンを描画しています。
ゲームの実行方法
マインスイーパーを実行するために、スクリプトファイル中のクラスmineSweeperと関数main()を読み込みます。
読み込んだ後は、コンソール上で次のようにmain()と実行しましょう。
1 | > main() |
実行すると、盤面の行数、列数、地雷の数を入力を求められます。好きな数字を入力しエンターを押しましょう。
1 2 3 | The number of rows:10 The number of cols:10 The number of bombs:10 |
エンターを入力すると、次の画像のようなwindowが起動します。
mineSweeper実行画面
盤面をクリックすることで、マインスイーパーを遊ぶことができます。
また、flagボタンがを押すことで、旗を置くことができます。flagを押した後はexploreボタンを押すと、探索モード(通常のモード)に切り替わります。
ゲームをクリアした後やゲームオーバーのとき、次の画像のようにwindow上にGame ClearやGame Overが表示された後に、コンソール上で"Do you wanto to Restart? Yes:1 No:0 "とゲームをリスタートするか質問されます。
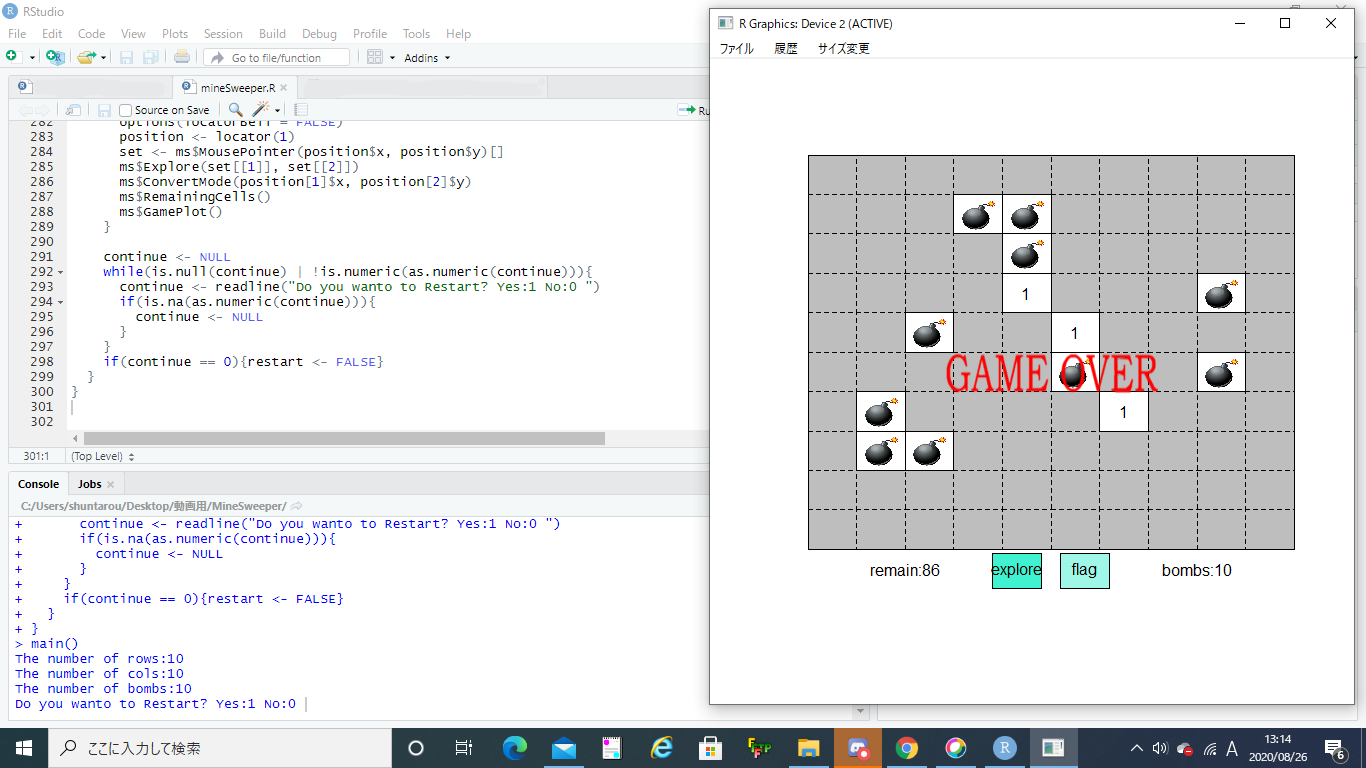
mineSweeperゲーム終了
リスタートしたいときは1を、終了したいときは0を押してください。
マインスイーパーの実行方法は以上となります。
ダウンロード方法
今回、紹介したマインスイーパーは以下のダウンロードリンクから入手できます。
スクリプトファイル以外にもゲームで用いられるpngファイル等が含まれています。
是非是非ダウンロードしてください。
R言語でゲームを作成する際の参考にしてくれたら幸いです。